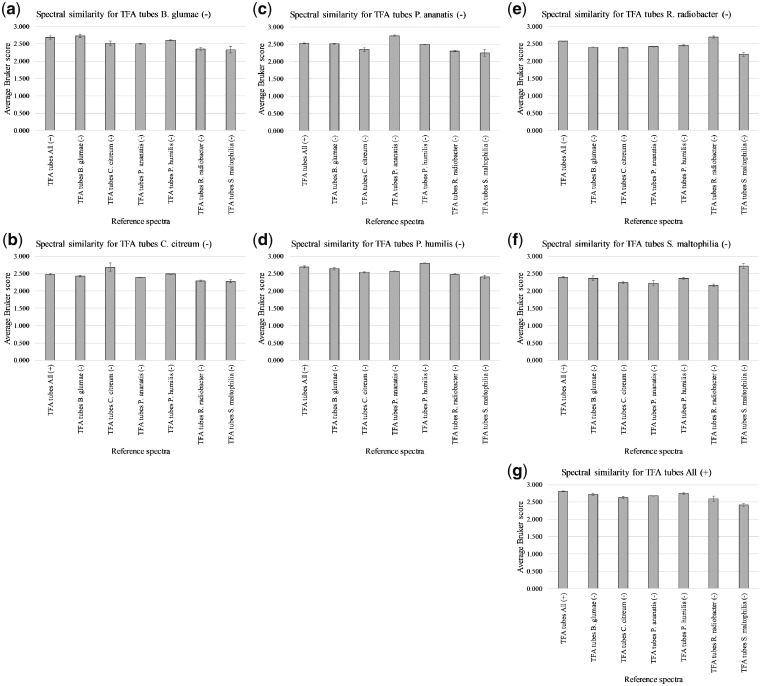
Figure 4:
Average Bruker scores for spectral comparison between (–) replicate-1 test samples (a) B. glumae, (b) C. citreum, (c) P. ananatis, (d) P. humilis, (e) R. radiobacter, (f) S. maltophilia, and (g) All (+) replicate-1 and (–) replicates 2 and 3/All (+) replicates 2 and 3 reference samples for TFA-based extractions.

