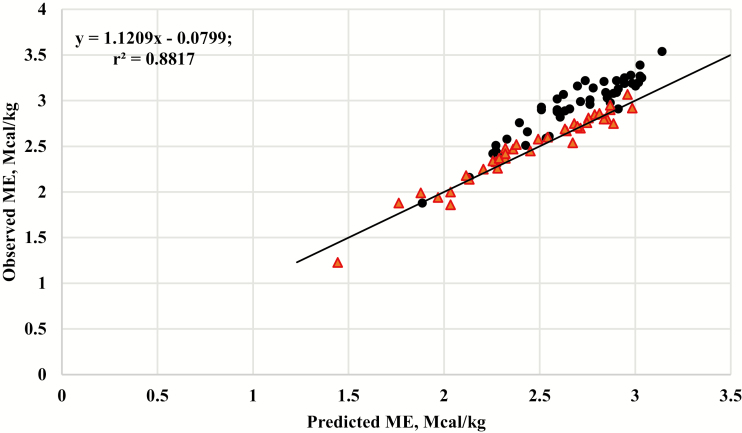
Figure 1.
The relationship between observed metabolizable energy (ME) and ME predicted from digestible energy (DE) using DE × 0.82 (National Research Council, 1974, 2000) for diets based on forage (red triangles) or based on concentrate grain (black circles), r2 = 0.8817. Data are means from the Galyean et al. (2016) databank. The solid black line represents the y = x, unity line.

