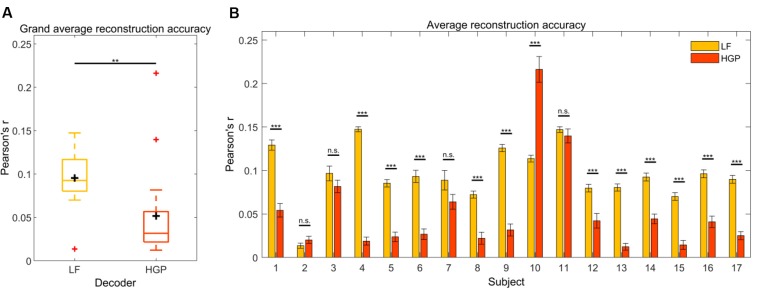
Figure 2.
(A) Grand average reconstruction accuracies across trials and subjects for the LF and HGP conditions. The black crosshairs are the mean reconstruction accuracies and the red crosshairs are outliers.Significance was calculated using paired t-tests (**p ≤ 0.01). (B) Mean (±SEM) reconstruction accuracy for each subject across trials for the LF and HGP conditions. Significance was calculated using paired t-tests (n.s., no significance, **p ≤ 0.01, and ***p ≤ 0.001).

