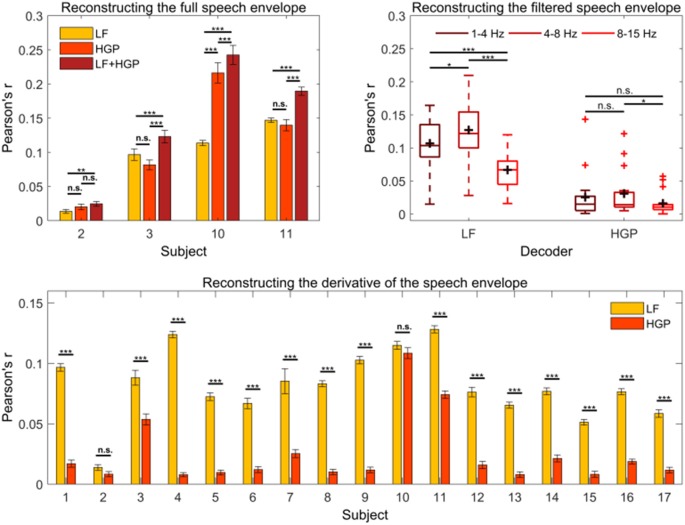
Figure 3.
(A) The mean (± SEM) reconstruction accuracies for subjects 2, 3, 10, and 11 using the LF, HGP, and LF+HGP models. Significance was calculated using Bonferroni corrected one-way repeated measures analysis of variance (ANOVA) tests (n.s., no significance, *p ≤ 0.05, **p ≤ 0.01, and ***p ≤ 0.001). (B) Average reconstruction accuracy of filtered speech (1–4 Hz, 4–8 Hz, and 8–15 Hz bands) using the LF and HGP EEG. The black crosshairs are mean reconstruction accuracies and the red crosshairs are outliers. Significance was found using a two-way repeated-measures ANOVA test. (C) Syllable onset correlations of the actual speech envelope in comparison to the reconstructed speech envelope for the LF and HGP conditions. Paired t-tests were used to calculate significance.

