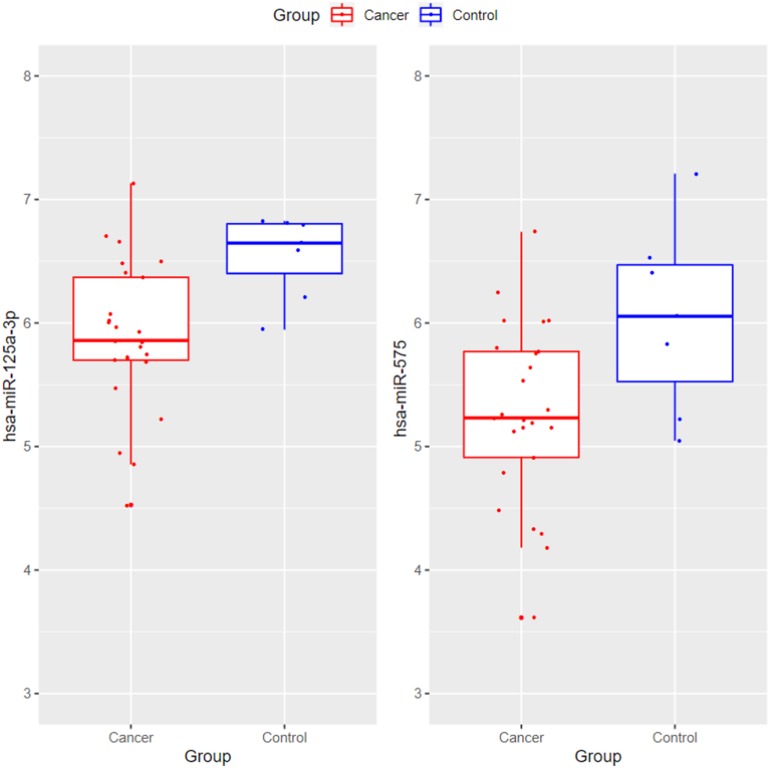
FIGURE 5.
The boxplots of hsa-miR-125a-3p and hsa-miR-575 between pancreatic cancer and control tissues. The t-test p-values of hsa-miR-125a-3p and hsa-miR-575 between cancer and control tissues were 0.00165 and 0.0384, respectively. Their expression levels were significantly lower in cancer tissues than in control tissues. The tissue results were consistent with our serum results.

