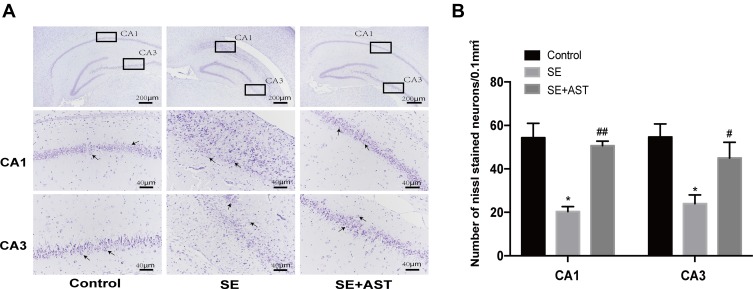
Figure 3.
The Nissl stain of hippocampus in rats. (A) The Nissl stain of rat hippocampus. (B) The number of Nissl stained neurons. Left: control group. Middle: status epilepticus group. Right: astaxanthin (AST) treated group. The general morphology of the hippocampus in rat magnification 40×. The CA1 and CA3 regions of hippocampus are marked in squares. CA1 and CA3 region magnification 400×. Positively stained cells are marked with black arrows. The cell density per square millimeter was measured by ImageJ software (n=4, *p <0.05 vs Control; #p <0.05 vs SE; ##p <0.01 vs SE by one-way ANOVA).

