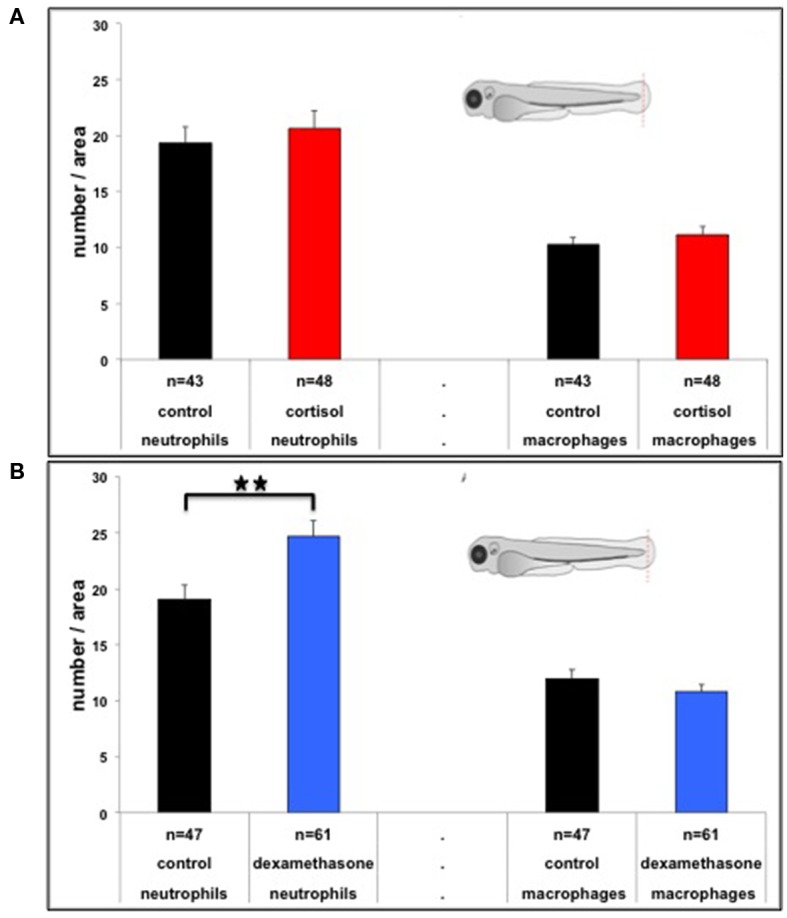
Figure 3.

(A) Number of neutrophils and macrophages (mean ± SEM) at 4 hpa for the different treatments (cortisol or control). (B) Number of neutrophils and macrophages (mean ± SEM) at 4 hpa for the different treatments (dexamethasone or control). In both panels the picture illustrates the position of the site of the tail fin amputation in 3 dpf larvae. **p = 0.01 (Student's t-test).
