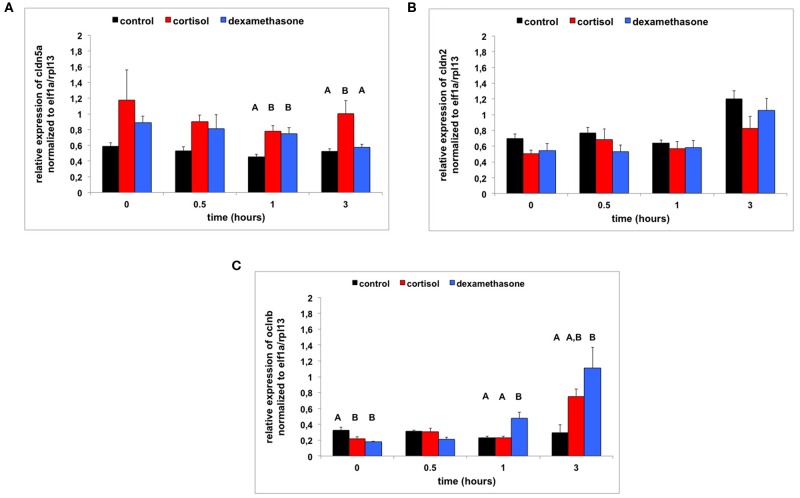
Figure 5.
(A) Transcript abundance (relative normalized expression; mean+SEM) of cldn5a following LPS treatment (from 0 to 0.5 h) and 0–6 hpf control treatment, cortisol treatment or dexamethasone treatment (n = 4 samples per time-point). Groups with the same capitals do not significantly differ from one another (Tukey HSD following a significant treatment effect for this time-point). Note: control-treated subjects showed no significant change over time: F(3, 12) = 2.009, ns. (B) Transcript abundance (relative normalized expression; mean + SEM) of cldn2 following LPS treatment (from 0 to 0.5 h) and 0–6 hpf control treatment, cortisol treatment or dexamethasone treatment (n = 4 samples per time-point). Note: control-treated subjects showed an increased expression at 3 h: F(3, 12) = 13.253, p < 0.001; Tukey HSD. (C) Transcript abundance (relative normalized expression; mean + SEM) of oclnb following LPS treatment (from 0 to 0.5 h) and 0–6 hpf control treatment, cortisol treatment or dexamethasone treatment (n = 4 samples per time-point). Groups with the same capitals do not significantly differ from one another (Tukey HSD following a significant treatment effect for this time-point). Note: control-treated subjects showed no significant change over time: F(3, 12) = 0.562, ns.

