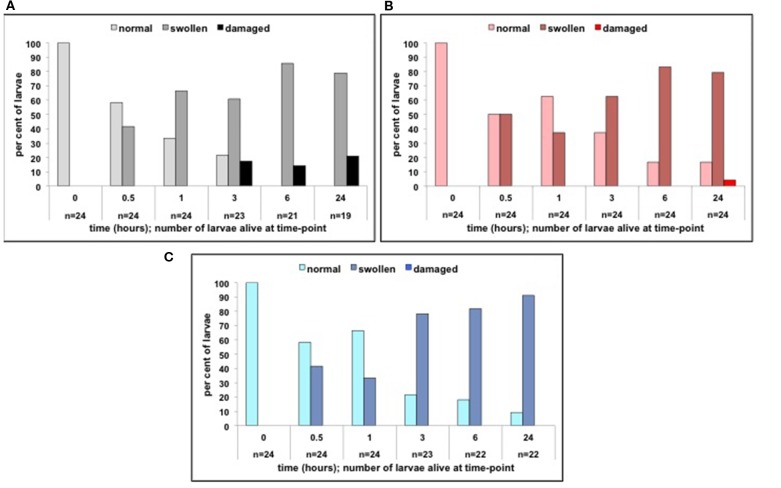
Figure 6.
(A) Per cent of larvae following LPS treatment (from 0 to 0.5 h) in the 0–6 hpf control treatment group showing normal, swollen, or damaged tail fins (time-points: 0, 0.5, 1, 3, 6, and 24 h). (B) Per cent of larvae following LPS treatment (from 0 to 0.5 h) in the 0–6 hpf cortisol treatment group showing normal, swollen or damaged tail fins (time-points: 0, 0.5, 1, 3, 6, and 24 h). (C) Per cent of larvae following LPS treatment (from 0 to 0.5 h) in the 0–6 hpf dexamethasone treatment group showing normal, swollen, or damaged tail fins (time-points: 0, 0.5, 1, 3, 6, and 24 h).

