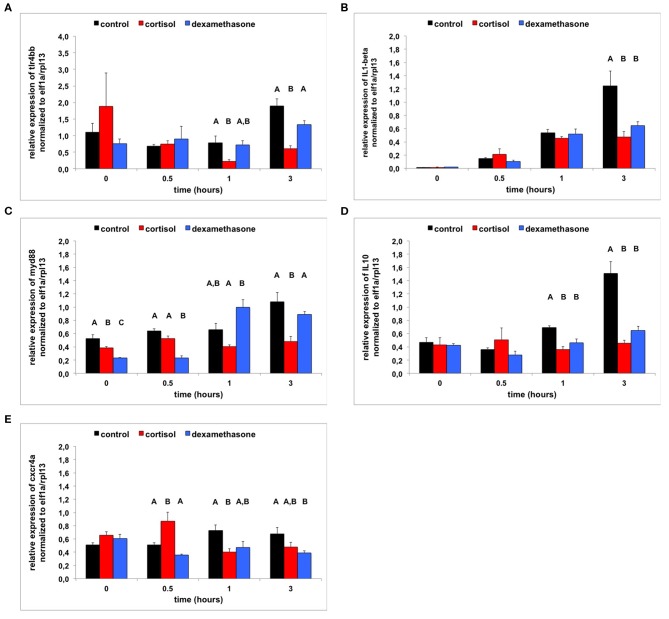
Figure 7.
(A) Transcript abundance (relative normalized expression; mean+SEM) of tlr44bb following LPS treatment (from 0 to 0.5 h) and 0–6 hpf control treatment, cortisol treatment or dexamethasone treatment (n = 4 samples per time-point). Groups with the same capitals do not significantly differ from one another (Tukey HSD following a significant treatment effect for this time-point). (B) Transcript abundance (relative normalized expression; mean + SEM) of IL1β following LPS treatment (from 0 to 0.5 h) and 0–6 hpf control treatment, cortisol treatment or dexamethasone treatment (n = 4 samples per time-point). Groups with the same capitals do not significantly differ from one another (Tukey HSD following a significant treatment effect for this time-point). (C) Transcript abundance (relative normalized expression; mean + SEM) of myd88 following LPS treatment (from 0 to 0.5 h) and 0–6 hpf control treatment, cortisol treatment or dexamethasone treatment (n = 4 samples per time-point). Groups with the same capitals do not significantly differ from one another (Tukey HSD following a significant treatment effect for this time-point). (D) Transcript abundance (relative normalized expression; mean+SEM) of IL10 following LPS treatment (from 0 to 0.5 h) and 0–6 hpf control treatment, cortisol treatment or dexamethasone treatment (n = 4 samples per time-point). Groups with the same capitals do not significantly differ from one another (Tukey HSD following a significant treatment effect for this time-point). (E) Transcript abundance (relative normalized expression; mean+SEM) of cxcr4a following LPS treatment (from 0 to 0.5 h) and 0–6 hpf control treatment, cortisol treatment or dexamethasone treatment (n = 4 samples per time-point). Groups with the same capitals do not significantly differ from one another (Tukey HSD following a significant treatment effect for this time-point).

