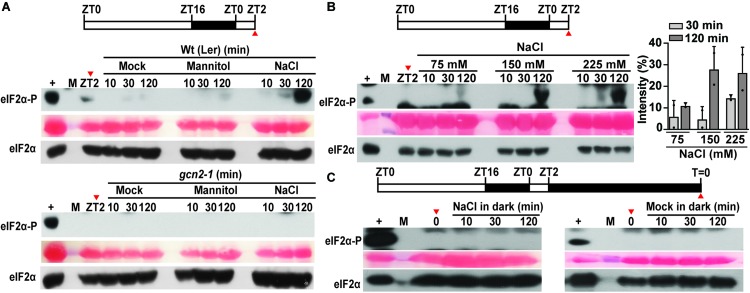
FIGURE 2.
Salt stress activates GCN2 kinase in light. (A) Top: Schematic of the growth regimen. Wt seedlings were grown for 9 days at 22°C in a 16 h light and 8 h dark cycle. The red arrow at ZT2 indicates the start of sampling right before the beginning of salt stress treatment. Bottom: eIF2α phosphorylation in 10-day-old Wt (Ler) and gcn2-1 mutant seedlings grown on medium containing 0.1% sucrose and shifted to mock conditions, or 300 mM mannitol or 150 mM NaCl. (B) Top: Schematics of the growth regimen. Bottom: eIF2α phosphorylation in 10-day-old Wt seedlings after shifting to different concentrations of NaCl (75, 150, 225 mM). Quantification of eIF2α phosphorylation at 30 and 120 min of NaCl treatment from two independent experiments is shown on the right. Error bars represent standard deviation. (C) Top: Schematics of 24 h dark acclimation starting at ZT2. Bottom: eIF2α phosphorylation in dark-acclimated Wt seedlings shifted to 150 mM NaCl (left) or to mock conditions (right). For details, see legend to Figure 1.

