Figure 3.
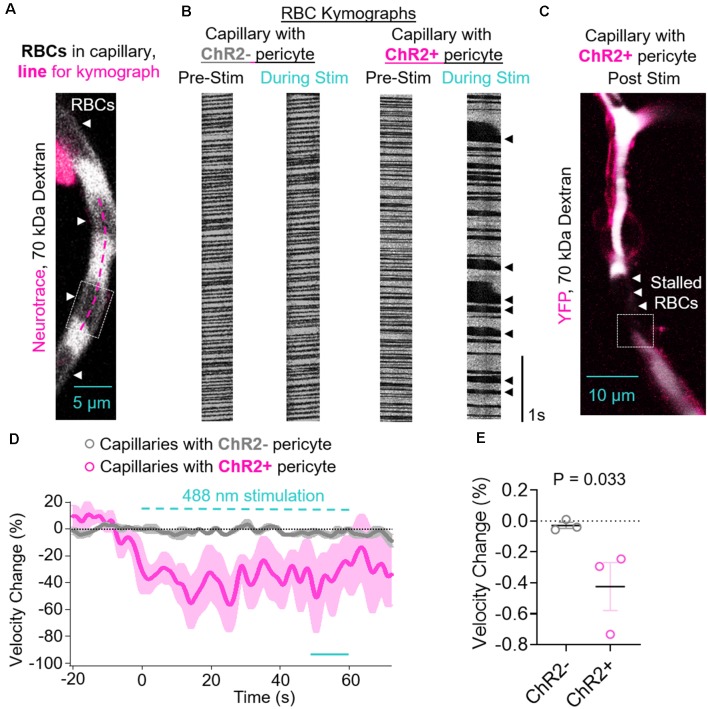
Contraction of ChR2-positive pericytes leads to reduced capillary red blood cell (RBC) velocity. (A) Representative image of a capillary with a ChR2− pericyte demonstrating how RBCs are visualized in locations that are not 70 kDa dextran-positive, and an example line for a kymograph drawn along the length of the capillary (fuschia dashed line). The dashed box indicates the location shown in Supplementary Video S2. (B) Representative RBC kymographs acquired pre-stimulation and during light stimulation (488 nm) of capillaries with a ChR2− or ChR2+ pericyte. Black arrows indicate areas of slowed or stalled RBC flow. (C) Representative lower magnification image of the vessel segment with ChR2+ pericyte visualized in panel (B) showing stalled RBC in brain capillaries after stimulation of ChR2+ pericytes. The dashed box indicates the location shown in Supplementary Video S3. (D) Average time courses by mouse of capillary RBC velocity changes for capillaries covered with ChR2− pericytes (gray circles) or ChR2+ pericytes (fuschia circles). Each single point along the time axis represents the mean ± SEM, from n = 26 capillaries with ChR2− pericytes from three control mice that do not express ChR2 and n = 14 capillaries with ChR2+ pericytes from three pericyte-CreER; ChR2 mice. RBC velocity before stimulation was arbitrarily taken as zero (0). The dashed cyan line indicates the 60 s 488 nm stimulation period. The unbroken cyan line indicates the 10 s period during stimulation quantified in panel (E). (E) Quantification of mean reduction in capillary RBC velocity (%) by mouse for ChR2− (gray circles) vs. ChR2+ pericyte (fuschia circles) capillaries over the last 10 s period during stimulation indicated in (D). Mean ± SEM, individual values averaged per mouse derived from n = 14–26 pericyte-covered capillaries from three mice per group. P = 0.033, by one-tailed student’s t-test.

