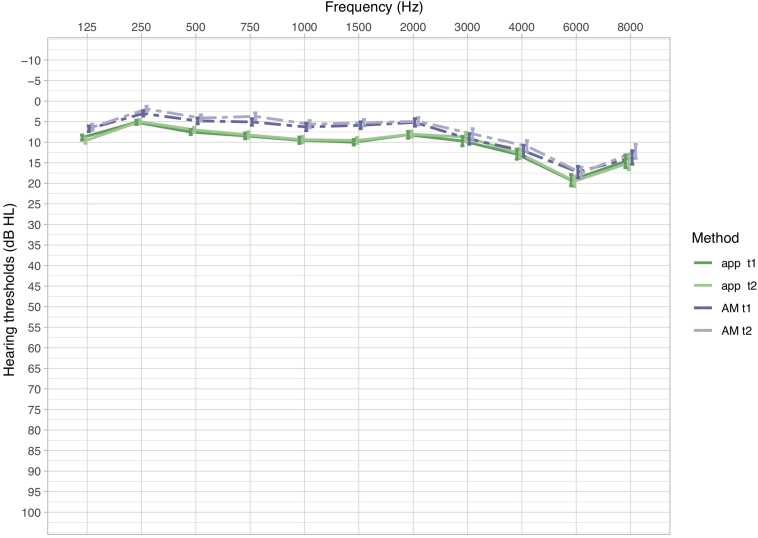
FIGURE 1.
Mean hearing thresholds in dB HL (±SEM) of measurements in the app and the AM for the first and second measurement (t1 and t2). Dashed lines indicate hearing thresholds of the AM, solid lines of the app. Lower dB HL values in the audiogram imply lower hearing thresholds, hence better hearing.

