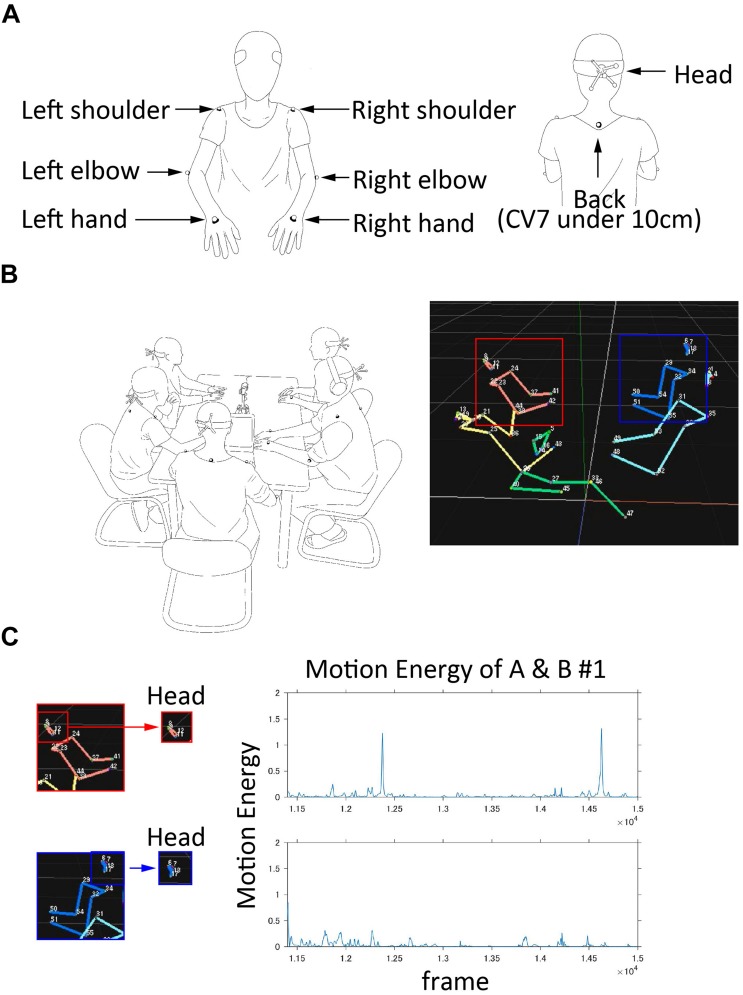
FIGURE 3.
(A) The attached placement of infrared reflection markers. (B) Left: Original video frame recorded in present experiment. Right: A frame reconstructed by the 3D coordinates of the infrared reflection markers. Participant A is shown as a red square and participant B is shown as a blue square. (C) Time series data of head movement. This was calculated as the sum of squared speed of the four markers attached to each participant’s head in each frame. The vertical axis is the sum of squared speed, and the horizontal axis is the frame. Using this data, we analyzed body movement synchrony.

