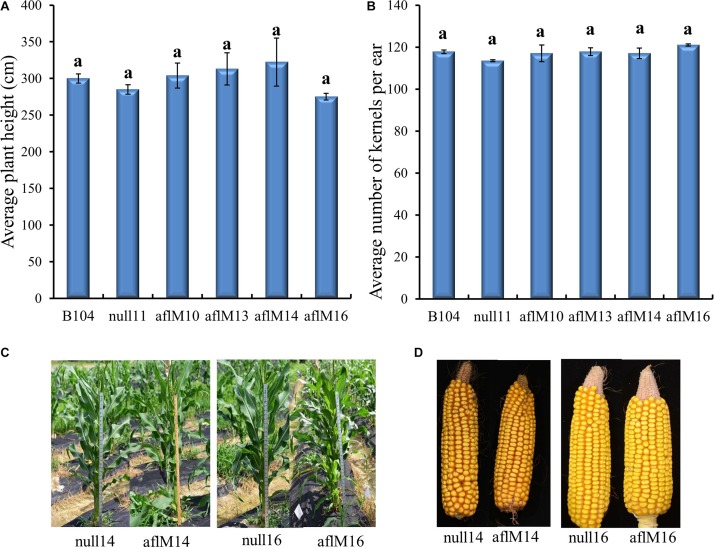
FIGURE 3.
Phenotypic assessment of transgenic plants and mature ears. (A) Average plant height in aflM10, aflM13, aflM14, and aflM16 in comparison to the null11 and B104 (wild type) controls at 50 days after planting at T1 generation. (B) Average number of T2 generation kernels per ear of aflM10, aflM13, aflM14, and aflM16 compared to null11 and B104 (wild type). Vertical bars represent standard errors of the means. Means with the same letters are not significantly different between treatments at P ≤ 0.05. (C) Representative appearance of plant height of null14, aflM14, null16 and aflM16 in T3 generation at 50 days after planting. (D) Representative appearance of dehusked mature maize ears from null14, aflM14, null16, and aflM16 at harvest (T4).

