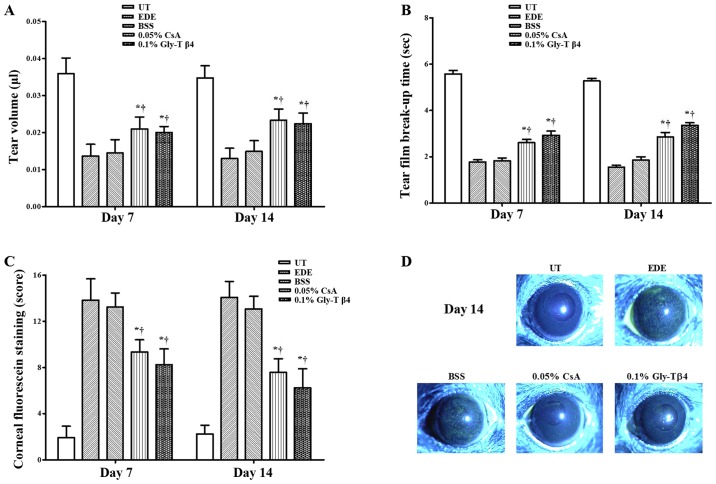
Figure 1.
Tear film and ocular surface parameters. (A) Mean tear volumes, (B) tear film break-up time, (C) corneal staining scores and (D) representative images of corneal staining in the UT, EDE, BSS, 0.05% CsA and 0.1% Gly-Tβ4 groups. The Gly-Tβ4 and CsA groups showed an improvement in all clinical parameters compared with the EDE and PSS groups. There were no significant differences between the two treatment groups after 7 and 14 days. *P<0.05 vs. EDE group; †P<0.05 vs. BSS group. UT, untreated control; EDE, experimental dry eye; BSS, balanced salt solution; CsA, Cyclosporine A; Gly-Tβ4, glycine-thymosin β4.

