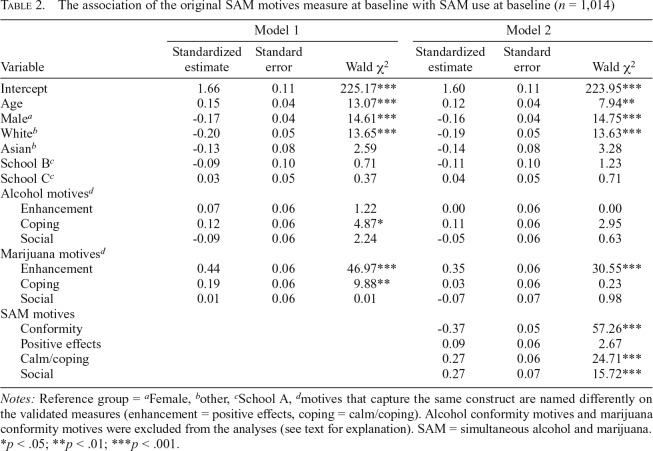
Table 2.
The association of the original SAM motives measure at baseline with SAM use at baseline (n = 1,014)
| Model 1 |
Model 2 |
|||||
| Variable | Standardized estimate | Standard error | Wald χ2 | Standardized estimate | Standard error | Wald χ2 |
| Intercept | 1.66 | 0.11 | 225.17*** | 1.60 | 0.11 | 223.95*** |
| Age | 0.15 | 0.04 | 13.07*** | 0.12 | 0.04 | 7.94** |
| Malea | -0.17 | 0.04 | 14.61*** | -0.16 | 0.04 | 14.75*** |
| Whiteb | -0.20 | 0.05 | 13.65*** | -0.19 | 0.05 | 13.63*** |
| Asianb | -0.13 | 0.08 | 2.59 | -0.14 | 0.08 | 3.28 |
| School Bc | -0.09 | 0.10 | 0.71 | -0.11 | 0.10 | 1.23 |
| School Cc | 0.03 | 0.05 | 0.37 | 0.04 | 0.05 | 0.71 |
| Alcohol motivesd | ||||||
| Enhancement | 0.07 | 0.06 | 1.22 | 0.00 | 0.06 | 0.00 |
| Coping | 0.12 | 0.06 | 4.87* | 0.11 | 0.06 | 2.95 |
| Social | -0.09 | 0.06 | 2.24 | -0.05 | 0.06 | 0.63 |
| Marijuana motivesd | ||||||
| Enhancement | 0.44 | 0.06 | 46.97*** | 0.35 | 0.06 | 30.55*** |
| Coping | 0.19 | 0.06 | 9.88** | 0.03 | 0.06 | 0.23 |
| Social | 0.01 | 0.06 | 0.01 | -0.07 | 0.07 | 0.98 |
| SAM motives | ||||||
| Conformity | -0.37 | 0.05 | 57.26*** | |||
| Positive effects | 0.09 | 0.06 | 2.67 | |||
| Calm/coping | 0.27 | 0.06 | 24.71*** | |||
| Social | 0.27 | 0.07 | 15.72*** | |||
Notes: Reference group = aFemale, bother, cSchool A, dmotives that capture the same construct are named differently on the validated measures (enhancement = positive effects, coping = calm/coping). Alcohol conformity motives and marijuana conformity motives were excluded from the analyses (see text for explanation). SAM = simultaneous alcohol and marijuana.
p < .05;
p < .01;
p < .001.

