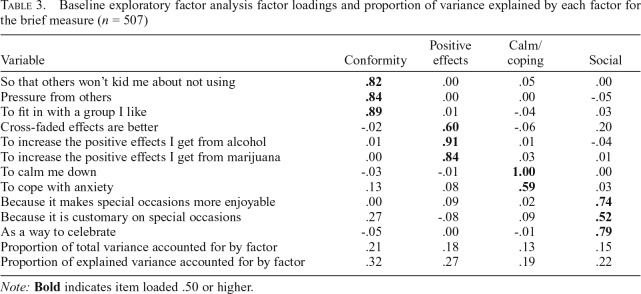
Table 3.
Baseline exploratory factor analysis factor loadings and proportion of variance explained by each factor for the brief measure (n = 507)
| Variable | Conformity | Positive effects | Calm/coping | Social |
| So that others won’t kid me about not using | .82 | .00 | .05 | .00 |
| Pressure from others | .84 | .00 | .00 | -.05 |
| To fit in with a group I like | .89 | .01 | -.04 | .03 |
| Cross-faded effects are better | -.02 | .60 | -.06 | .20 |
| To increase the positive effects I get from alcohol | .01 | .91 | .01 | -.04 |
| To increase the positive effects I get from marijuana | .00 | .84 | .03 | .01 |
| To calm me down | -.03 | -.01 | 1.00 | .00 |
| To cope with anxiety | .13 | .08 | .59 | .03 |
| Because it makes special occasions more enjoyable | .00 | .09 | .02 | .74 |
| Because it is customary on special occasions | .27 | -.08 | .09 | .52 |
| As a way to celebrate | -.05 | .00 | -.01 | .79 |
| Proportion of total variance accounted for by factor | .21 | .18 | .13 | .15 |
| Proportion of explained variance accounted for by factor | .32 | .27 | .19 | .22 |
Note: Bold indicates item loaded .50 or higher.

