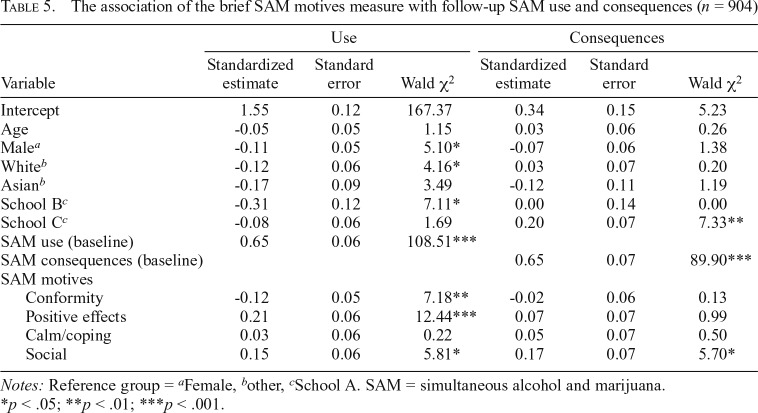
Table 5.
The association of the brief SAM motives measure with follow-up SAM use and consequences (n = 904)
| use |
Consequences |
|||||
| Variable | Standardized estimate | Standard error | Wald χ2 | Standardized estimate | Standard error | Wald χ2 |
| Intercept | 1.55 | 0.12 | 167.37 | 0.34 | 0.15 | 5.23 |
| Age | -0.05 | 0.05 | 1.15 | 0.03 | 0.06 | 0.26 |
| Malea | -0.11 | 0.05 | 5.10* | -0.07 | 0.06 | 1.38 |
| Whiteb | -0.12 | 0.06 | 4.16* | 0.03 | 0.07 | 0.20 |
| Asianb | -0.17 | 0.09 | 3.49 | -0.12 | 0.11 | 1.19 |
| School Bc | -0.31 | 0.12 | 7.11* | 0.00 | 0.14 | 0.00 |
| School Cc | -0.08 | 0.06 | 1.69 | 0.20 | 0.07 | 7.33** |
| SAM use (baseline) | 0.65 | 0.06 | 108.51*** | |||
| SAM consequences (baseline) | 0.65 | 0.07 | 89.90*** | |||
| SAM motives | ||||||
| Conformity | -0.12 | 0.05 | 7.18** | -0.02 | 0.06 | 0.13 |
| Positive effects | 0.21 | 0.06 | 12.44*** | 0.07 | 0.07 | 0.99 |
| Calm/coping | 0.03 | 0.06 | 0.22 | 0.05 | 0.07 | 0.50 |
| Social | 0.15 | 0.06 | 5.81* | 0.17 | 0.07 | 5.70* |
Notes: Reference group = aFemale, bother, cSchool A. SAM = simultaneous alcohol and marijuana.
p < .05;
p < .01;
p < .001.

