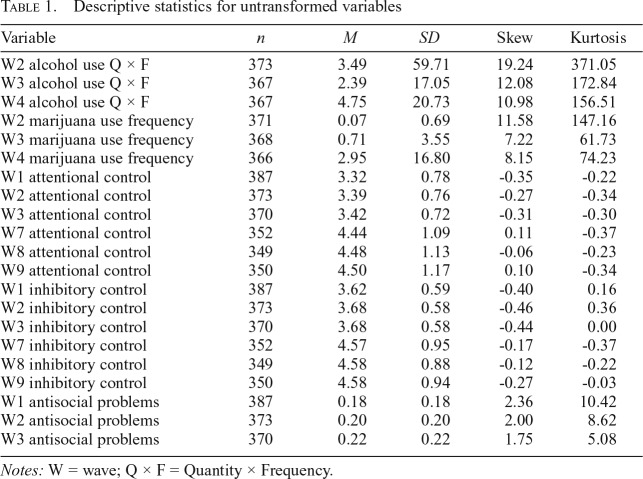
Table 1.
Descriptive statistics for untransformed variables
| Variable | n | M | SD | Skew | Kurtosis |
| W2 alcohol use Q × F | 373 | 3.49 | 59.71 | 19.24 | 371.05 |
| W3 alcohol use Q × F | 367 | 2.39 | 17.05 | 12.08 | 172.84 |
| W4 alcohol use Q × F | 367 | 4.75 | 20.73 | 10.98 | 156.51 |
| W2 marijuana use frequency | 371 | 0.07 | 0.69 | 11.58 | 147.16 |
| W3 marijuana use frequency | 368 | 0.71 | 3.55 | 7.22 | 61.73 |
| W4 marijuana use frequency | 366 | 2.95 | 16.80 | 8.15 | 74.23 |
| W1 attentional control | 387 | 3.32 | 0.78 | -0.35 | -0.22 |
| W2 attentional control | 373 | 3.39 | 0.76 | -0.27 | -0.34 |
| W3 attentional control | 370 | 3.42 | 0.72 | -0.31 | -0.30 |
| W7 attentional control | 352 | 4.44 | 1.09 | 0.11 | -0.37 |
| W8 attentional control | 349 | 4.48 | 1.13 | -0.06 | -0.23 |
| W9 attentional control | 350 | 4.50 | 1.17 | 0.10 | -0.34 |
| W1 inhibitory control | 387 | 3.62 | 0.59 | -0.40 | 0.16 |
| W2 inhibitory control | 373 | 3.68 | 0.58 | -0.46 | 0.36 |
| W3 inhibitory control | 370 | 3.68 | 0.58 | -0.44 | 0.00 |
| W7 inhibitory control | 352 | 4.57 | 0.95 | -0.17 | -0.37 |
| W8 inhibitory control | 349 | 4.58 | 0.88 | -0.12 | -0.22 |
| W9 inhibitory control | 350 | 4.58 | 0.94 | -0.27 | -0.03 |
| W1 antisocial problems | 387 | 0.18 | 0.18 | 2.36 | 10.42 |
| W2 antisocial problems | 373 | 0.20 | 0.20 | 2.00 | 8.62 |
| W3 antisocial problems | 370 | 0.22 | 0.22 | 1.75 | 5.08 |
Notes: W = wave; Q × F = Quantity × Frequency.

