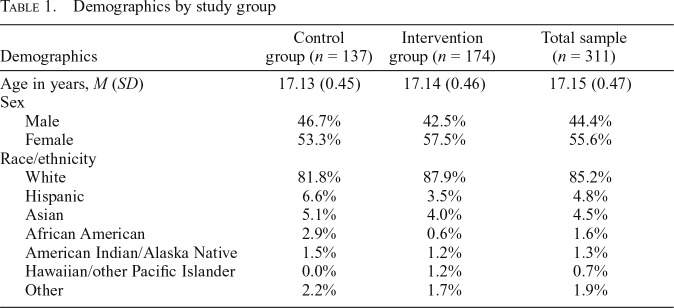
Table 1.
Demographics by study group
| Demographics | Control group (n = 137) | Intervention group (n = 174) | Total sample (n = 311) |
| Age in years, M (SD) | 17.13 (0.45) | 17.14 (0.46) | 17.15 (0.47) |
| Sex | |||
| Male | 46.7% | 42.5% | 44.4% |
| Female | 53.3% | 57.5% | 55.6% |
| Race/ethnicity | |||
| White | 81.8% | 87.9% | 85.2% |
| Hispanic | 6.6% | 3.5% | 4.8% |
| Asian | 5.1% | 4.0% | 4.5% |
| African American | 2.9% | 0.6% | 1.6% |
| American Indian/Alaska Native | 1.5% | 1.2% | 1.3% |
| Hawaiian/other Pacific Islander | 0.0% | 1.2% | 0.7% |
| Other | 2.2% | 1.7% | 1.9% |

