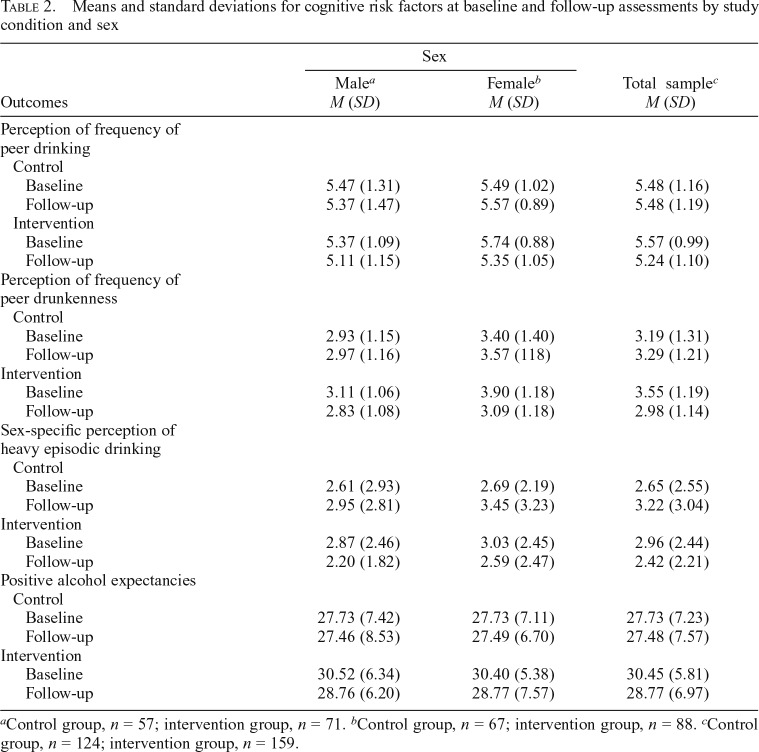
Table 2.
Means and standard deviations for cognitive risk factors at baseline and follow-up assessments by study condition and sex
| Sex |
|||
| Outcomes | Malea M (SD) | Femaleb M (SD) | Total samplec M (SD) |
| Perception of frequency of peer drinking | |||
| Control | |||
| Baseline | 5.47 (1.31) | 5.49 (1.02) | 5.48 (1.16) |
| Follow-up | 5.37 (1.47) | 5.57 (0.89) | 5.48 (1.19) |
| Intervention | |||
| Baseline | 5.37 (1.09) | 5.74 (0.88) | 5.57 (0.99) |
| Follow-up | 5.11 (1.15) | 5.35 (1.05) | 5.24 (1.10) |
| Perception of frequency of peer drunkenness | |||
| Control | |||
| Baseline | 2.93 (1.15) | 3.40 (1.40) | 3.19 (1.31) |
| Follow-up | 2.97 (1.16) | 3.57 (118) | 3.29 (1.21) |
| Intervention | |||
| Baseline | 3.11 (1.06) | 3.90 (1.18) | 3.55 (1.19) |
| Follow-up | 2.83 (1.08) | 3.09 (1.18) | 2.98 (1.14) |
| Sex-specific perception of heavy episodic drinking | |||
| Control | |||
| Baseline | 2.61 (2.93) | 2.69 (2.19) | 2.65 (2.55) |
| Follow-up | 2.95 (2.81) | 3.45 (3.23) | 3.22 (3.04) |
| Intervention | |||
| Baseline | 2.87 (2.46) | 3.03 (2.45) | 2.96 (2.44) |
| Follow-up | 2.20 (1.82) | 2.59 (2.47) | 2.42 (2.21) |
| Positive alcohol expectancies | |||
| Control | |||
| Baseline | 27.73 (7.42) | 27.73 (7.11) | 27.73 (7.23) |
| Follow-up | 27.46 (8.53) | 27.49 (6.70) | 27.48 (7.57) |
| Intervention | |||
| Baseline | 30.52 (6.34) | 30.40 (5.38) | 30.45 (5.81) |
| Follow-up | 28.76 (6.20) | 28.77 (7.57) | 28.77 (6.97) |
Control group, n = 57; intervention group, n = 71.
Control group, n = 67; intervention group, n = 88.
Control group, n = 124; intervention group, n = 159.

