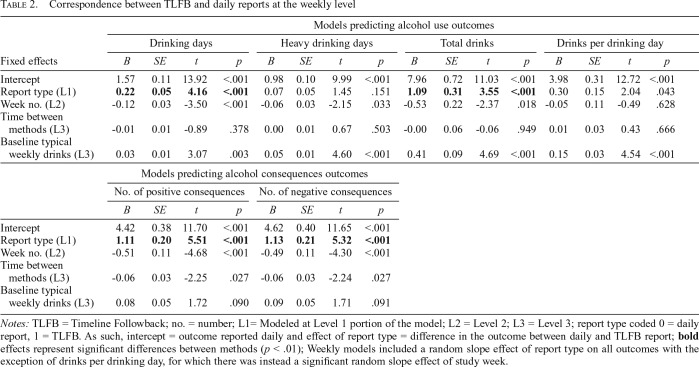
Table 2.
Correspondence between TLFB and daily reports at the weekly level
| Models predicting alcohol use outcomes |
||||||||||||||||
| Drinking days |
Heavy drinking days |
Total drinks |
Drinks per drinking day |
|||||||||||||
| Fixed effects | B | SE | t | p | B | SE | t | p | B | SE | t | p | B | SE | t | p |
| Intercept | 1.57 | 0.11 | 13.92 | <.001 | 0.98 | 0.10 | 9.99 | <.001 | 7.96 | 0.72 | 11.03 | <.001 | 3.98 | 0.31 | 12.72 | <.001 |
| Report type (L1) | 0.22 | 0.05 | 4.16 | <.001 | 0.07 | 0.05 | 1.45 | .151 | 1.09 | 0.31 | 3.55 | <.001 | 0.30 | 0.15 | 2.04 | .043 |
| Week no. (L2) | -0.12 | 0.03 | -3.50 | <.001 | -0.06 | 0.03 | -2.15 | .033 | -0.53 | 0.22 | -2.37 | .018 | -0.05 | 0.11 | -0.49 | .628 |
| Time between methods (L3) | -0.01 | 0.01 | -0.89 | .378 | 0.00 | 0.01 | 0.67 | .503 | -0.00 | 0.06 | -0.06 | .949 | 0.01 | 0.03 | 0.43 | .666 |
| Baseline typical weekly drinks (L3) | 0.03 | 0.01 | 3.07 | .003 | 0.05 | 0.01 | 4.60 | <.001 | 0.41 | 0.09 | 4.69 | <.001 | 0.15 | 0.03 | 4.54 | <.001 |
| Models predicting alcohol consequences outcomes |
||||||||||||||||
| No. of positive consequences |
No. of negative consequences |
|||||||||||||||
| B | SE | t | p | B | SE | t | p | |||||||||
| Intercept | 4.42 | 0.38 | 11.70 | <.001 | 4.62 | 0.40 | 11.65 | <.001 | ||||||||
| Report type (L1) | 1.11 | 0.20 | 5.51 | <.001 | 1.13 | 0.21 | 5.32 | <.001 | ||||||||
| Week no. (L2) | -0.51 | 0.11 | -4.68 | <.001 | -0.49 | 0.11 | -4.30 | <.001 | ||||||||
| Time between methods (L3) | -0.06 | 0.03 | -2.25 | .027 | -0.06 | 0.03 | -2.24 | .027 | ||||||||
| Baseline typical weekly drinks (L3) | 0.08 | 0.05 | 1.72 | .090 | 0.09 | 0.05 | 1.71 | .091 | ||||||||
Notes: TLFB = Timeline Followback; no. = number; L1= Modeled at Level 1 portion of the model; L2 = Level 2; L3 = Level 3; report type coded 0 = daily report, 1 = TLFB. As such, intercept = outcome reported daily and effect of report type = difference in the outcome between daily and TLFB report; bold effects represent significant differences between methods (p < .01); Weekly models included a random slope effect of report type on all outcomes with the exception of drinks per drinking day, for which there was instead a significant random slope effect of study week.

