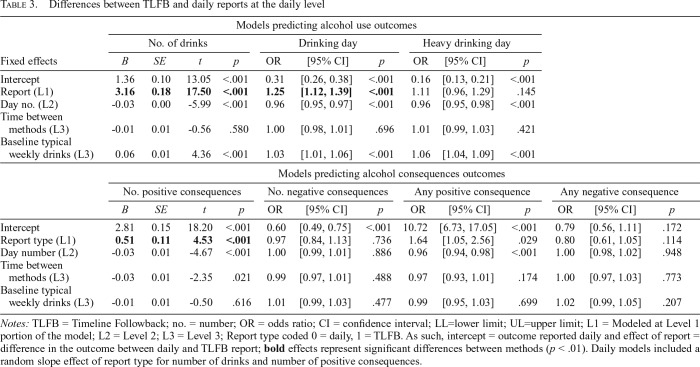
Table 3.
Differences between TLFB and daily reports at the daily level
| Models predicting alcohol use outcomes |
|||||||||||||
| No. of drinks |
Drinking day |
Heavy drinking day |
|||||||||||
| Fixed effects | B | SE | t | p | OR | [95% CI] | p | OR | [95% CI] | p | |||
| Intercept | 1.36 | 0.10 | 13.05 | <.001 | 0.31 | [0.26, 0.38] | <.001 | 0.16 | [0.13, 0.21] | <.001 | |||
| Report (L1) | 3.16 | 0.18 | 17.50 | <.001 | 1.25 | [1.12, 1.39] | <.001 | 1.11 | [0.96, 1.29] | .145 | |||
| Day no. (L2) | -0.03 | 0.00 | -5.99 | <.001 | 0.96 | [0.95, 0.97] | <.001 | 0.96 | [0.95, 0.98] | <.001 | |||
| Time between methods (L3) | -0.01 | 0.01 | -0.56 | .580 | 1.00 | [0.98, 1.01] | .696 | 1.01 | [0.99, 1.03] | .421 | |||
| Baseline typical weekly drinks (L3) | 0.06 | 0.01 | 4.36 | <.001 | 1.03 | [1.01, 1.06] | <.001 | 1.06 | [1.04, 1.09] | <.001 | |||
| Models predicting alcohol consequences outcomes |
|||||||||||||
| No. positive consequences |
No. negative consequences |
Any positive consequence |
Any negative consequence |
||||||||||
| B | SE | t | p | OR | [95% CI] | p | OR | [95% CI] | p | OR | [95% CI] | p | |
| Intercept | 2.81 | 0.15 | 18.20 | <.001 | 0.60 | [0.49, 0.75] | <.001 | 10.72 | [6.73, 17.05] | <.001 | 0.79 | [0.56, 1.11] | .172 |
| Report type (L1) | 0.51 | 0.11 | 4.53 | <.001 | 0.97 | [0.84, 1.13] | .736 | 1.64 | [1.05, 2.56] | .029 | 0.80 | [0.61, 1.05] | .114 |
| Day number (L2) | -0.03 | 0.01 | -4.67 | <.001 | 1.00 | [0.99, 1.01] | .886 | 0.96 | [0.94, 0.98] | <.001 | 1.00 | [0.98, 1.02] | .948 |
| Time between methods (L3) | -0.03 | 0.01 | -2.35 | .021 | 0.99 | [0.97, 1.01] | .488 | 0.97 | [0.93, 1.01] | .174 | 1.00 | [0.97, 1.03] | .773 |
| Baseline typical weekly drinks (L3) | -0.01 | 0.01 | -0.50 | .616 | 1.01 | [0.99, 1.03] | .477 | 0.99 | [0.95, 1.03] | .699 | 1.02 | [0.99, 1.05] | .207 |
Notes: TLFB = Timeline Followback; no. = number; OR = odds ratio; CI = confidence interval; LL=lower limit; UL=upper limit; L1 = Modeled at Level 1 portion of the model; L2 = Level 2; L3 = Level 3; Report type coded 0 = daily, 1 = TLFB. As such, intercept = outcome reported daily and effect of report = difference in the outcome between daily and TLFB report; bold effects represent significant differences between methods (p < .01). Daily models included a random slope effect of report type for number of drinks and number of positive consequences.

