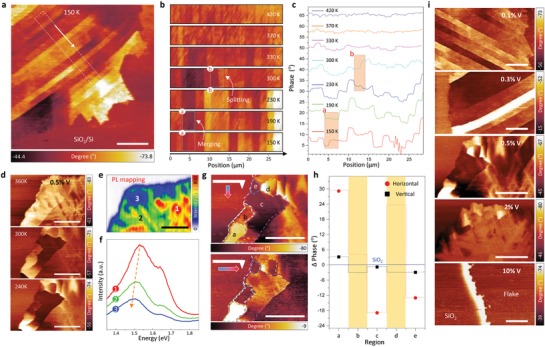
Figure 2.

MFM with magnetic domains in V‐doped WSe2. a) MFM phase image of 0.1% V‐doped WSe2 taken at 150 K. b) Temperature‐dependent transition of magnetic domains and c) related phase profiles in the white‐dotted box in (a). d) Temperature‐dependent MFM phase images of 0.5% V‐doped WSe2. e) Photoluminescence mapping and f) the corresponding spectra at different positions numbered in (e). g) MFM response of 0.5% V‐doped WSe2 with different magnetized directions of tip at 240 K. h) Average phase signal of regions indicated by the letters in (g). The phase value for SiO2 is set to zero for the reference. i) Magnetic domains of V‐doped WSe2 with different V‐concentrations. All scale bars, 10 µm.
