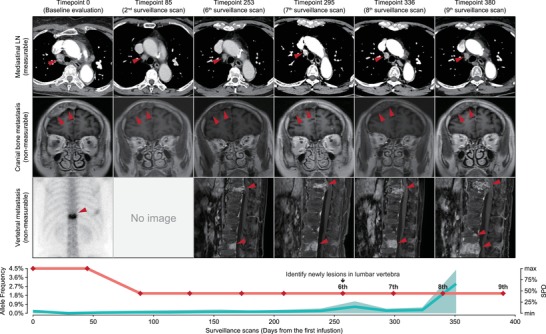
Figure 3.

Radiological and serological follow‐ups for P2 with unmeasurable lesions. Upper panels, surveillance CT, MRI scans (with contrast), or ECT showing the change in tumor burden over time in the mediastinal lymph node (LN), cranial bone, and lumbar vertebrae. Red arrowheads indicate the lesion site. Lower panel, clinical course. Red lines, SPD; green line with shadow, mean ctDNA MAF with the range for all detected mutations in ctDNA.
