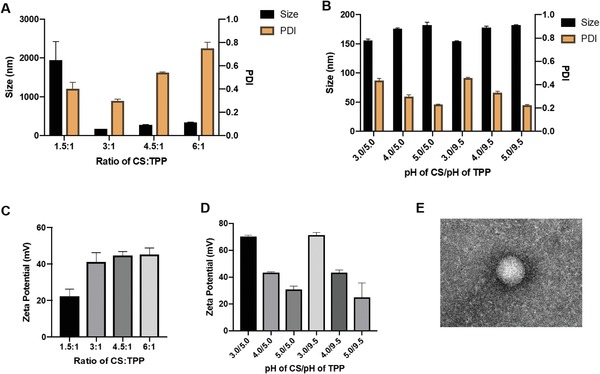
Figure 2.

Assembly and characterization of chitosan–TPP nanoparticles. A) Effect of different ratios of chitosan and TPP on the size and PDI of the nanoparticles. B) Effect of pH of chitosan and TPP on size and PDI of nanoparticles. The pH of chitosan was varied between 3 and 5, while the pH of TPP was either 5 or 9.5. C) Zeta potential of nanoparticles at different chitosan:TPP ratios. D) Zeta potential of nanoparticles as a function of pH of chitosan and TPP at a chitosan:TPP ratio of 3:1. The pH of chitosan was varied between 3 and 5, while the pH of TPP was either 5 or 9.5. E) TEM image of nanoparticle. Scale bar: 100 nm.
