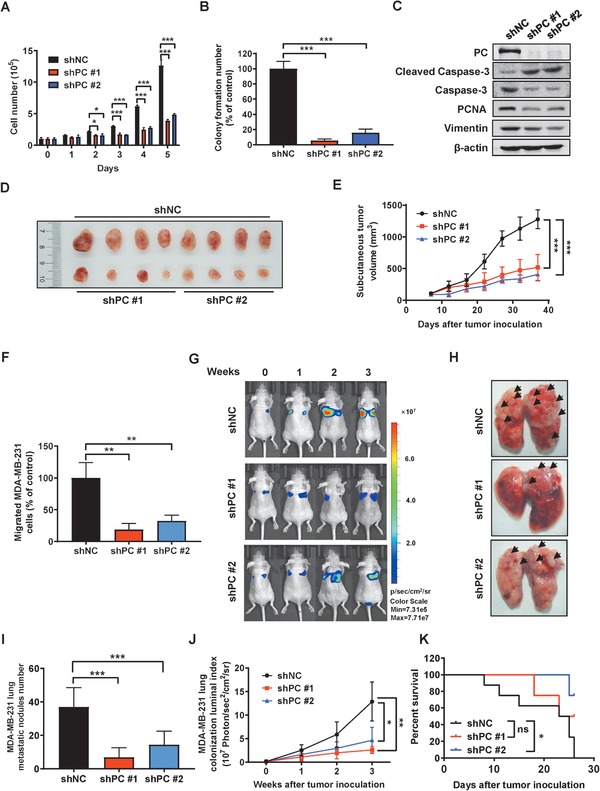
Figure 5.

PC inhibition impaired BCA growth and lung metastases in vitro and in vivo. A) The cell numbers of shNC and shPC MDA‐MB‐231 cells were counted over 5 days. B) Colony numbers of shNC and shPC MDA‐MB‐231 cells were counted after 10 days. C) Expression of biomarkers relevant to apoptosis and migration in shNC and shPC MDA‐MB‐231 cells. D) Scrambled control cells (shNC, n = 8) and PC depleted MDA‐MB‐231 cells (shPC, n = 4 for each shRNA construct) were subcutaneously implanted in female nude mice. Resulting tumors were harvested after 37 days and are shown. E) Tumor volume progression in the shNC and shPC groups. F) The quantification of invasive cell counts of shNC and shPC MDA‐MB‐231 cells in a transwell assay. G–K) A time course of IVIS imaging was performed to detect lung colonization in the shNC group (n = 8) and two shPC groups (n = 4). G) Representative bioluminescent images were shown over three weeks. H) The arrowheads point to the visible tumor colonies in the harvested lungs. I) The numbers of lung metastatic nodules were counted. J) The whole body IVIS images provided the quantification of bioluminescent signaling from the luciferase tagged tumor cells in each group. K) The Kaplan–Meier survival curve. Data shown are mean ± s.d. p < 0.05, *; p < 0.01, **; p < 0.001, ***; ns, not significant.
