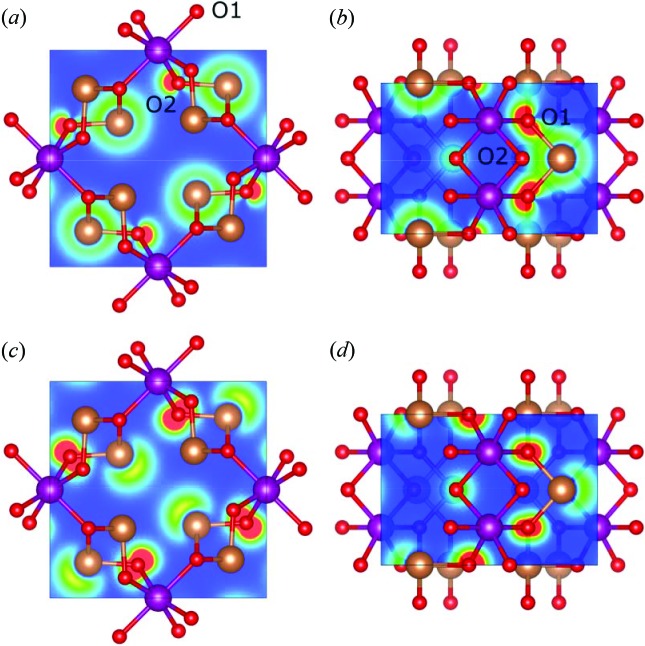
Figure 3.
Valence electron density in selected planes and regions from Fig. 2 ▸. (a) and (b) Region I, (c) and (d) Region III. (a) and (c) (001) plane at z = 1/2, (b) and (d) plane spanned by Sb and two equivalent O1 atoms. Contours are drawn from 0 (blue) to 0.0445 e bohr−3 (red). Mn is shown as purple, Sb as brown and O as red, and the two crystallographically unique O atoms are again marked as O1 and O2 in (a) and (b). The figures were generated using VESTA (Momma & Izumi, 2008 ▸).

