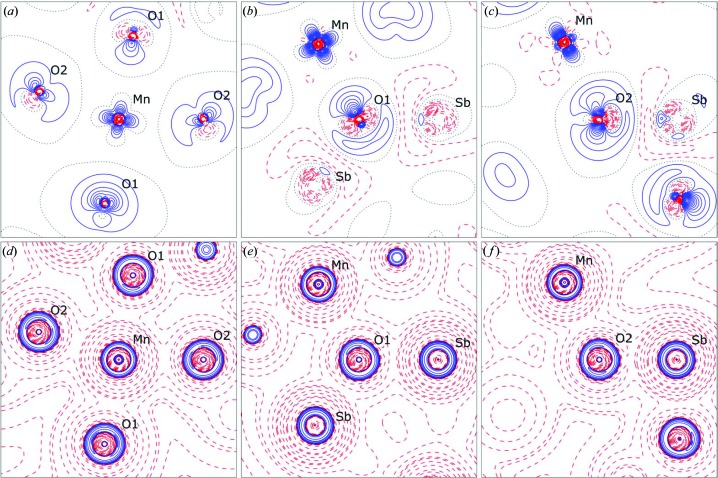
Figure 7.
(a)–(c) Deformation densities in the planes containing the labelled nuclei; positive (solid blue), negative (dashed red) and zero (dotted black) contours are shown and contour spacings are 0.1 e Å−3 in (a) and 0.05 e Å−3 in (b) and (c). (d)–(f) Negative Laplacian of the electron density in selected planes; positive (solid blue), negative (dashed red) and zero (dotted black) contours are shown at a × 10n, where a = 1, 2, 4, 8 and n = −2, −1, 0, 1, 2, 3, 4.

