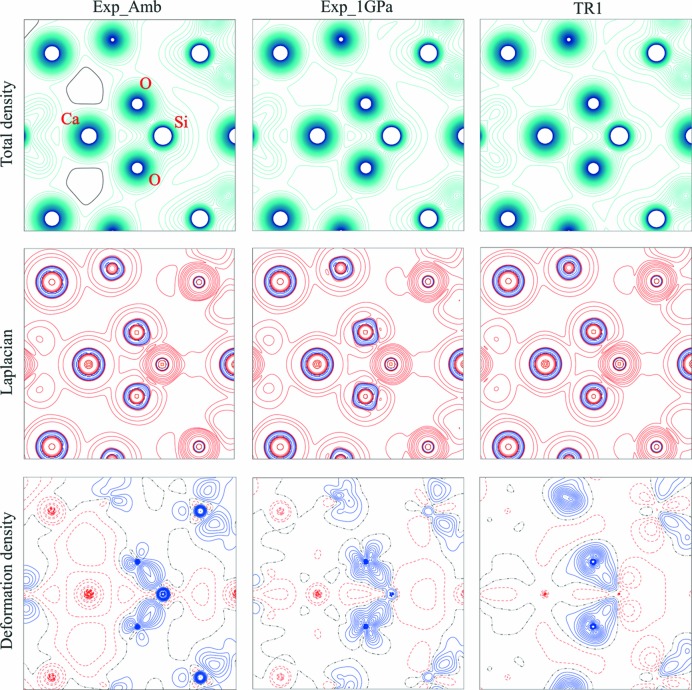
Figure 3.
Maps of electron density distribution for the Ca–Si–O plane. Contour values for total density and deformation density are 0.1 e Å−3 and 0.05 e Å−3, respectively. For Laplacian maps, particular contours are ±2, 4, 8, 20, 40, 80, 200, 400 and 1000 e Å−5. Blue contours denote positive values and red contours correspond to negative values. The same color scheme is adopted for the deformation density maps.

