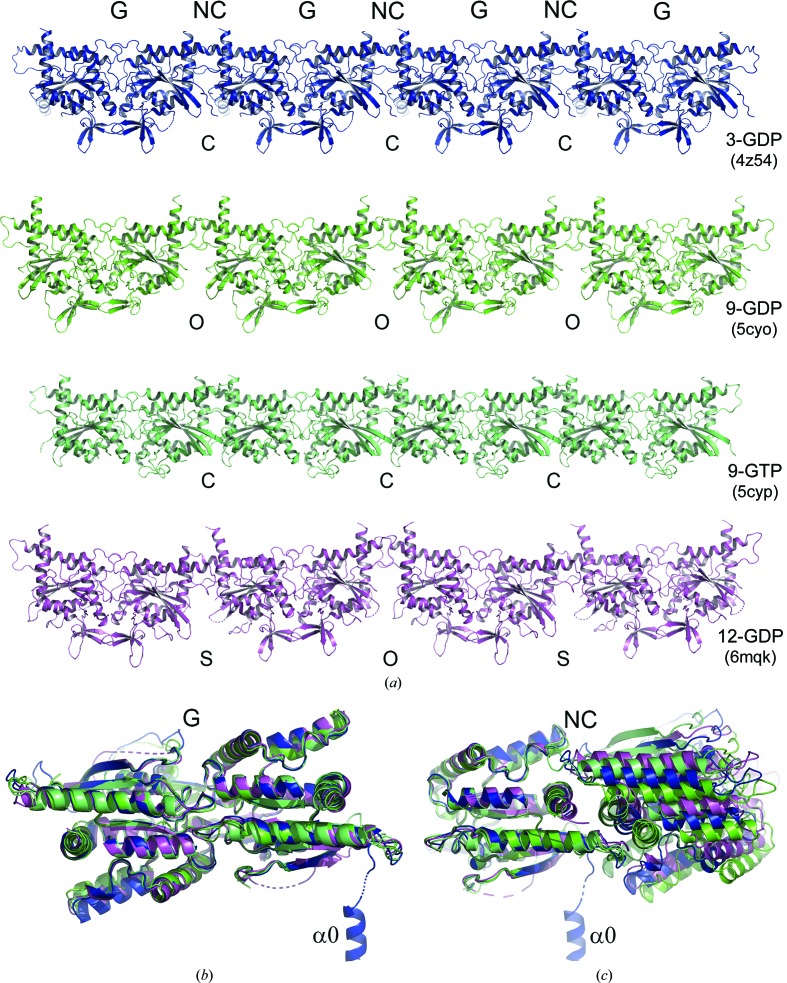
Figure 3.
G and NC interfaces formed within the crystal structures. (a) Filaments observed on generating symmetry-related molecules for four representative structures. G and NC interfaces are observed in all cases, with variation occurring only at the latter. SEPT3 α0G–GDP (PDB entry 4z54) shows only closed (C) NC interfaces, SEPT9GC–GDP (PDB entry 5cyo) has only open (O) NC interfaces, SEPT9GC–GTPγS (PDB entry 5cyp) has closed interfaces which are slightly more squeezed than in SEPT3G–GDP, and SEPT12G–GDP (PDB entry 6mqk) has both open and shifted (S) NC interfaces which alternate along the filament. The filaments formed in the SEPT3G–GMPPNP complex (PDB entry 4z51) show similar interfaces to SEPT3α0G–GDP, and those formed by SEPT12G–GMPPNP (PDB entry 6mq9) are similar to those in SEPT12–GDP. (b) Superposition of G-interface dimers for the four structures shown in (a), revealing minimal structural variation. (c) Superposition of one subunit (left) of an NC dimer for each of the structures shown in (a). Considerable variation in the position of the second subunit is an indication of the different conformational states (O, C or S) of the interface. Helix α0 of the SEPT3α0G–GDP complex is specifically highlighted. The colours used for each complex will be preserved in subsequent figures.

