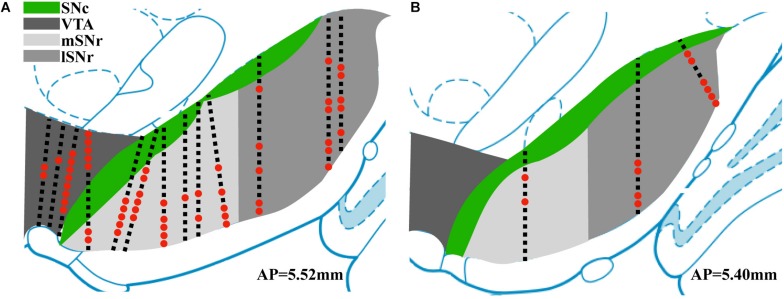
FIGURE 3.
Summary of position of electrode tracks based on histology. (A) Electrode tracks in coronal section corresponding to AP 5.52 mm (Paxinos and Watson, 2007). (B) Electrode tracks in coronal section corresponding to AP 5.40 mm. Black squares indicate recording sites with no sorted single units. Red dots indicate recording sites with sorted single units.

