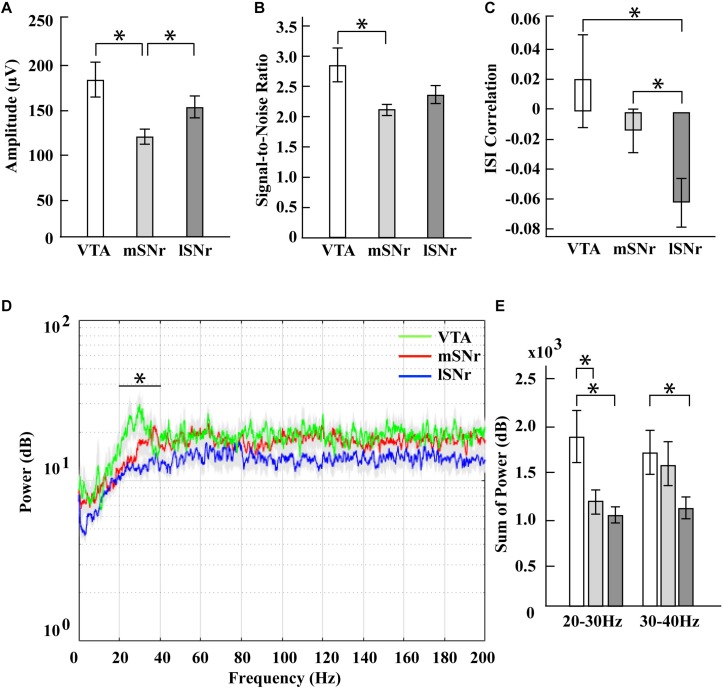
FIGURE 4.
Electrophysiological results in mSNr, lSNr and VTA. (A) Spike amplitudes in mSNr, lSNr and VTA. (B) Signal-to-noise ratio in mSNr, lSNr and VTA. (C) ISI correlation in mSNr, lSNr and VTA. (D) Spectral power in mSNr, lSNr and VTA. Mean (colored lines) ± SEM (gray filled area surrounding colored lines) are shown. (E) Sum of power in 20–30 Hz and 30–40 Hz frequency bands. Mean ± SEM (SEM indicated by gray filled area surrounding lines) are shown. Features that showed statistically significant differences are indicated with *p < 0.05.

