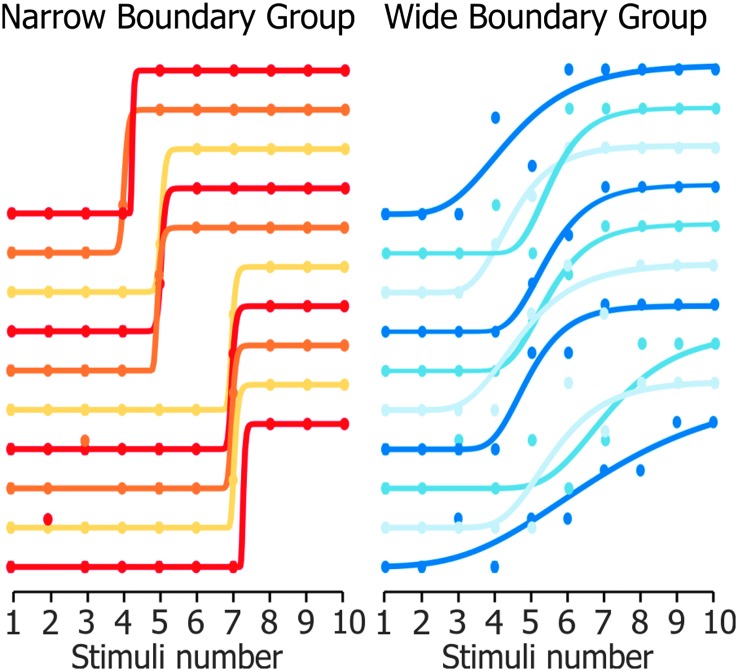
Figure 6.
Identification curves for all participants, divided into narrow and wide boundary groups (n = 10 each). The x-axes represent the stimuli number. The y-axes are omitted. Each curve starts with 0 identification percentage at Stimuli 1 and ends with 100 identification percentage at Stimuli 10.

