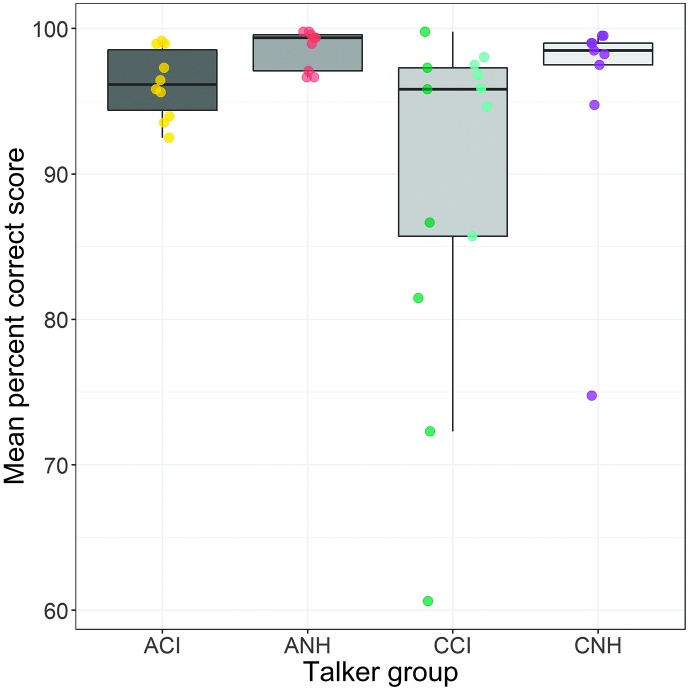
Figure 1.
Boxplots of the percent correct scores obtained by normal hearing adult listeners attending to the productions by the four talker groups (abscissa). A mean percent correct score was calculated for each talker by averaging scores across all listeners for that talker. The actual mean scores are overlaid on the boxplots as dots. The two sets of mutually offset dots overlaid on the boxplot for children with cochlear implants' (CCI) data correspond to scores from the two listener groups attending to the two subsets of CCIs (Group 1 CCI and Group 2 CCI) who were tested at different times. ACI = adults with cochlear implants; ANH = adults with normal hearing; CNH = children with normal hearing.

