
Figure 5.
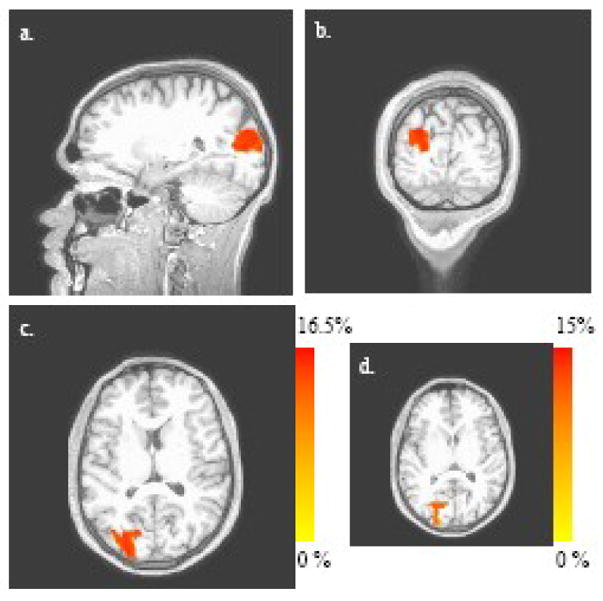
5(a)–(c): Difference between the fractions of the 20-s post-stimulus time interval that image voxels spend in State 2+3 (i.e., either State 2 or State 3) and State 5+6 (maximal difference = 16.1%). Three orthogonal views (sagittal, coronal and axial, respectively) of the time-fraction response to visual stimulation are shown (corrected significance level of α = 0.05). The axial view for the time-fraction difference between State 2 and State 5 is shown in Fig. 5(d) (maximal difference = 14.5%).