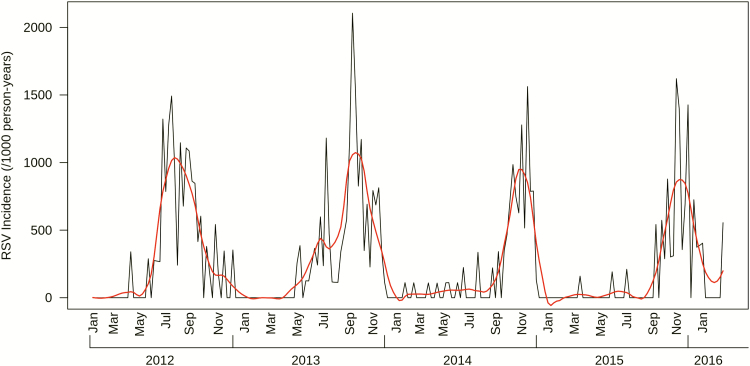
Figure 2.
Incidences of symptomatic RSV illness by study week. The black line reflects the incidence rate of symptomatic RSV illnesses by week of study, while the red line shows a Loess smoothing function applied to the data to illustrate the seasonal trend of RSV transmission. Data were truncated at the beginning and end of the study when the total number of participants in the study was below 100. Abbreviation: Loess, locally estimated scatterplot smoothing; RSV, respiratory syncytial virus.

