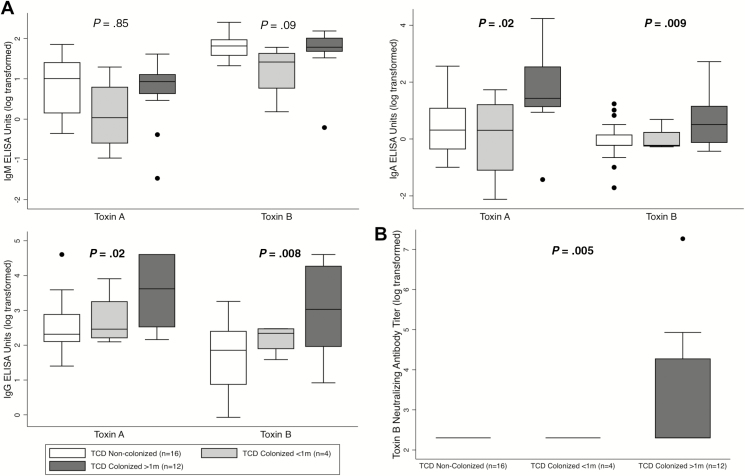
Figure 3.
A, Association between TCD colonization and serum IgM (top left), IgA (top right), and IgG (bottom left) against toxins A and B. B Association between TCD colonization and toxin B NAb titers (bottom right). Data are expressed as AU (A) or NAb titers (B) on a natural logarithmic scale. Boxes delineate the median and IQR, whiskers delineate the upper and lower adjacent values (within 1.5 × IQR), and isolated data points are outliers. Reported P values are for comparisons between non–TCD-colonized infants and infants with TCD colonization for at least 1 month’s duration. Bolded P values are statistically significant. Abbreviations: ELISA, enzyme-linked immunosorbent assay; Ig, immunoglobulin; IQR, interquartile range; Nab, neutralizing antibody; TCD, toxigenic Clostridioides difficile.

