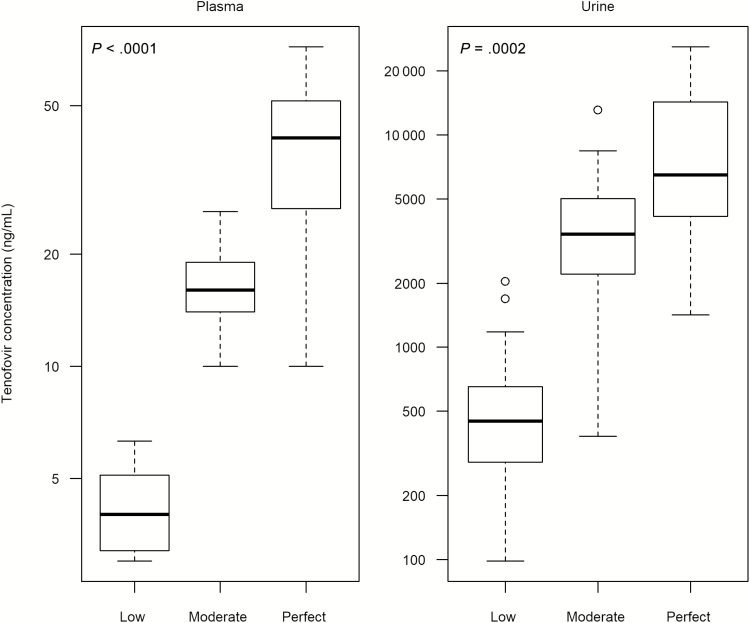
Figure 3.
Trough tenofovir concentrations in plasma and spot urine by randomized adherence arm (“low” = 2 doses/week, sampled 96 hours after dosing; “moderate” = 4 doses/week, 48 hours after dosing; “perfect” = 7 doses/week, 24 hours after dosing) at steady state. The thick center line in each box plot indicates the median, top of the box marks the 75th percentile, bottom of the box marks the 25th percentile, and whiskers mark upper and lower bounds excluding outliers. Outliers are defined as values 1.5 times the interquartile range above the upper quartile or below the lower quartile. Six plasma tenofovir concentrations that were detectable but below the lower limit of quantification (3.0 ng/mL) in the low adherence group were assigned a value of 1.5 ng/mL.

