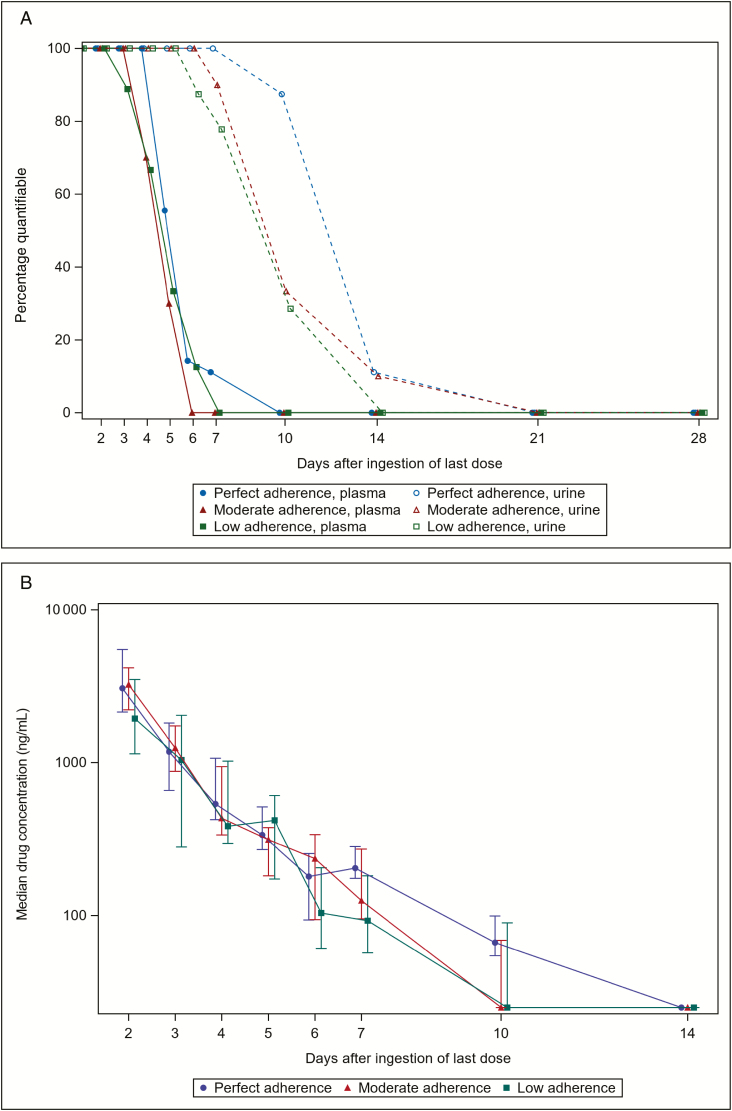
Figure 4.
Proportion of plasma and urine samples with tenofovir (TFV) levels above the limit of quantification (A), and median TFV concentration in urine (B), for liquid chromatography–tandem mass spectrometry during the drug washout period. A, Plasma is indicated with a solid line and urine with a dotted line. Threshold of detection was <3 ng/mL for plasma and <50 ng/mL for urine. Sample size of 7, 7, and 8 in the perfect, moderate, and low adherence arms, respectively, on day 6. B, Interquartile range is represented by a vertical bar for each day and each adherence arm. Sample size of 7, 7, and 8 in the perfect, moderate, and low adherence arms, respectively, on day 6. Single imputation was performed for samples with detectable TFV concentrations but below the lower limit of quantification (50 ng/mL) using 25 ng/mL.

