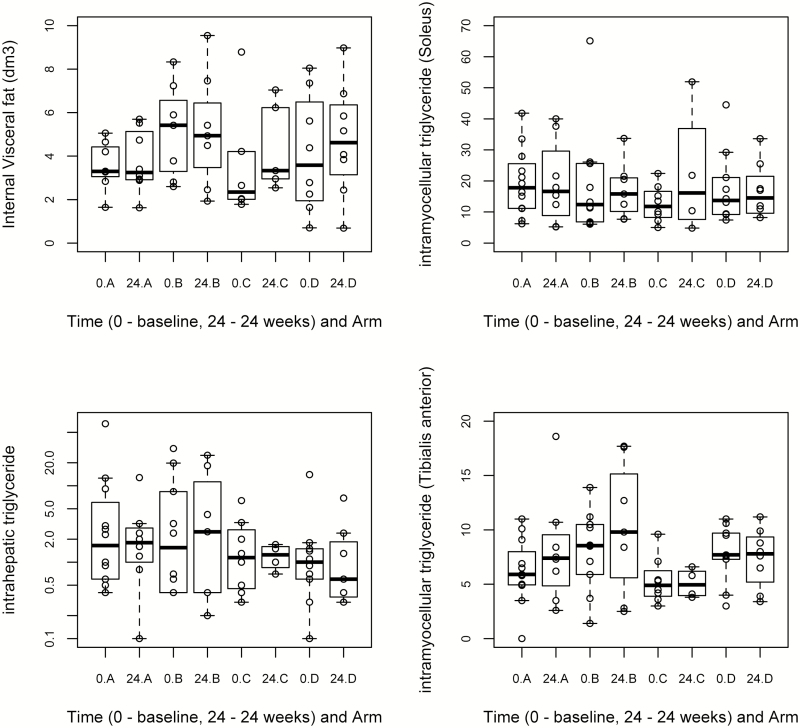
Figure 6.
Box plots for the MRI and 1H MRS measurements at baseline (0) and 24 weeks by treatment group (with individual data points). “A” refers to the control arm; “B,” “C,” and “D” refer to arms treated with 20, 40, and 80 mg of telmisartan, respectively. Intrahepatic and intramyocellular triglyceride contents are expressed as ratios (CH2 relative to unsuppressed water and as CH2 relative to creatine signal, respectively). The vertical axis for intrahepatic triglyceride content has been plotted in logarithmic scale to include the extreme values. Abbreviations: MRI, magnetic resonance imaging; MRS, magnetic resonance spectroscopy.

