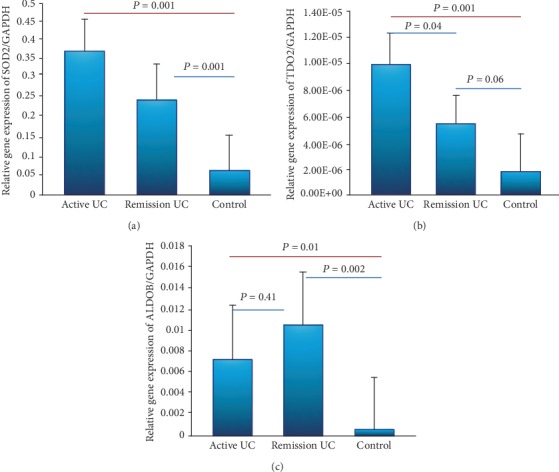
Figure 5.

Gene expression panel of oxidoreductases enzymes. Relative gene expression was quantified by RT-PCR. (a) SOD2, (b) TDO2, and (c) ALDOB transcript levels with GAPDH as housekeeping gene determined by 2∆∆Ct; differences among groups were assessed by Kruskal-Wallis test, and P values are presented in the figure.
