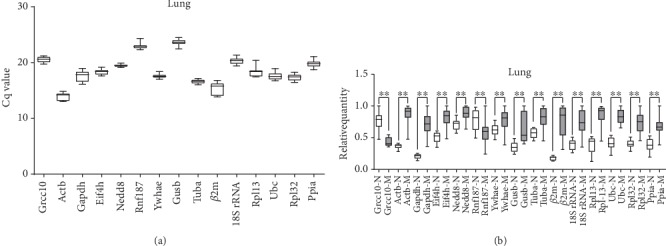
Figure 5.

Distribution of quantification cycle (Cq) value and relative quantity for candidate reference genes. Box-whisker plot showing raw Cq values (a) and relative quantity (b) distribution of each reference gene in lung tissue. Boxes represent the quartiles with medians, whereas the maximum and minimum values are represented by whiskers.
