
Figure 10.
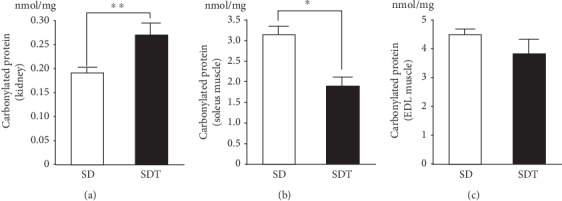
Expression profiles of carbonylated proteins in kidney (a), soleus (b), and EDL muscle (c) tissues. Values are presented as the mean ± SEM. ∗p < 0.05 and ∗∗p < 0.01 vs. SD rats.
Official websites use .gov
A
.gov website belongs to an official
government organization in the United States.
Secure .gov websites use HTTPS
A lock (
) or https:// means you've safely
connected to the .gov website. Share sensitive
information only on official, secure websites.
Expression profiles of carbonylated proteins in kidney (a), soleus (b), and EDL muscle (c) tissues. Values are presented as the mean ± SEM. ∗p < 0.05 and ∗∗p < 0.01 vs. SD rats.