Figure 3.

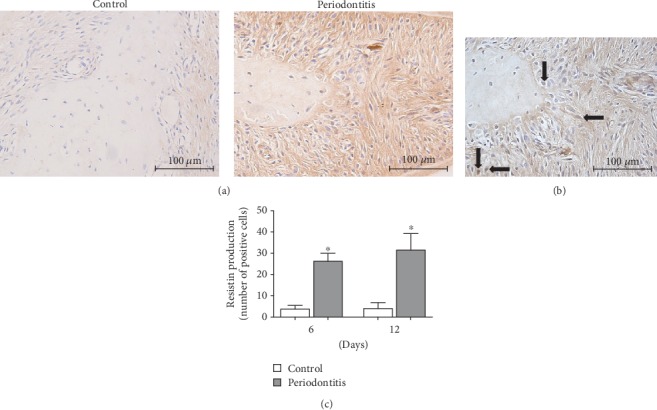
Representative images (100x magnification) of IHC staining for resistin in the first maxillary molars of rats from the control and periodontitis groups (a). Representative image (400x magnification) showing in greater scale some cells positive for resistin pointed by black arrows in the periodontitis group (b). Results are expressed as the mean ± SD (n = 6). The graph shows an increase in the number of cells positive for resistin in comparison to the control group (c). ∗Significant difference (p < 0.05).
