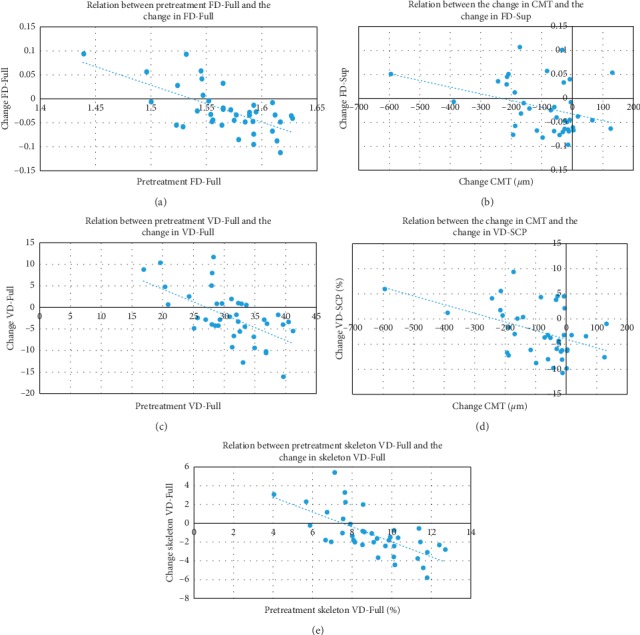
Figure 5.

Examples of scatter plots for factors significantly associated with posttreatment changes using univariate analysis. There was a significant negative correlation between (a) pretreatment FD-Full and the change in FD-Full (r = −0.541, p < 0.001), (b) the change in CMT and the change in FD-SCP (r = −0.324, p=0.042), (c) pretreatment VD-Full and the change in VD-Full (r = −0.560, p < 0.001), (d) the change in CMT and the change in VD-SCP (r = −0.389, p=0.013), and (e) pretreatment skeleton VD-Full and the change in skeleton VD-Full (r = −0.694, p < 0.001).
