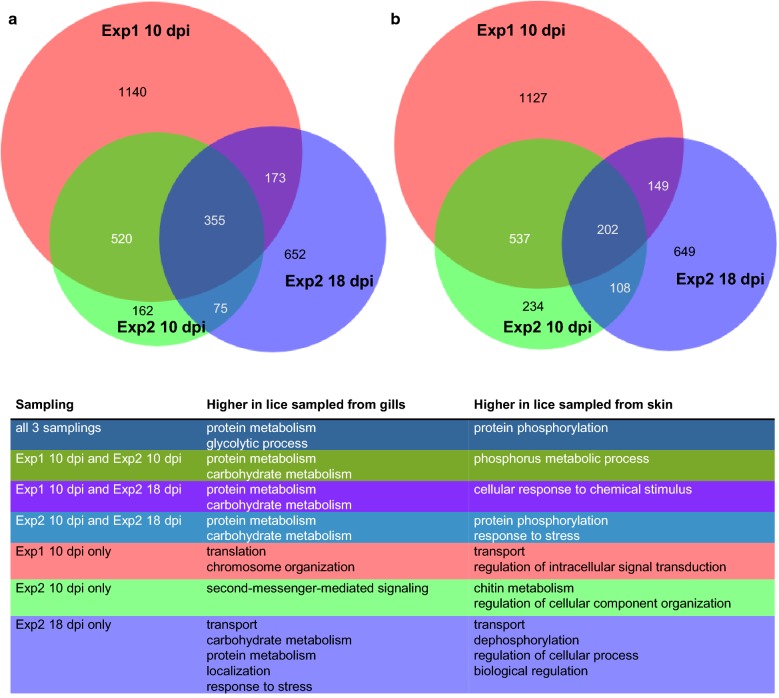
Fig. 4.
Scaled Venn diagrams for differentially expressed genes found in lice from skin and from gills. The Venn diagrams are showing the number of differentially expressed genes (DESeq2; Padj < 0.05) between chalimus larvae sampled from gills versus those sampled from skin, for Experiment (Exp) 1, sampled at 10 days post-infestation (dpi), Experiment 2, sampled at 10 dpi and Experiment 2 sampled at 18 dpi. The numbers of genes elevated in chalimus larvae sampled from gills in the different samplings are shown in (a) and the numbers of genes elevated in chalimus larvae sampled from fish skin in the different samplings are shown in (b). Representative GO terms for each group are given in the table in the bottom panel. A full list of enriched GO terms is shown in Additional file 15: Table S9 which are summarized as Tree maps in Additional file 1: Figure S1

