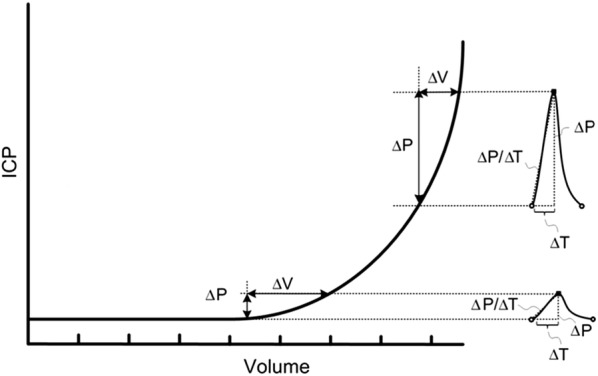
Fig. 1.

The intracranial pressure–volume curve. There is a non-linear relationship between change in intracranial pressure (ICP) and intracranial volume (Volume). At the flat portion of the curve, the pressure–volume reserve or buffering capacity is good (i.e. the intracranial compartment accepts a rather large change in intracranial volume without resulting in increased ICP). This implies that intracranial elastance is low (intracranial compliance is high). At the vertical portion of the curve, a small change in intracranial volume causes a marked rise in ICP; pressure–volume reserve capacity is low (high intracranial elastance or low intracranial compliance). The pressure–volume curve was established from measuring mean ICP. In the context of pulsatile ICP, at the flat portion of the curve the net intracranial blood volume change during the cardiac beat (about 1 ml) causes a small single wave amplitude (< 3–4 mmHg). At the vertical portion of the curve, the same net intracranial blood volume change during the cardiac beat (about 1 ml) results in a much larger ICP wave amplitude (> 4–5 mmHg).
From Wagshul et al. [32]
