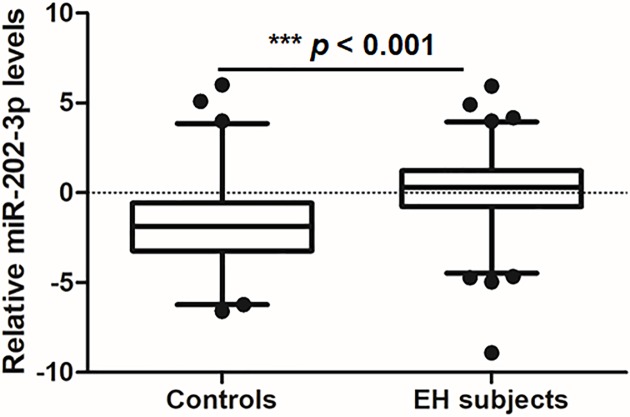
Figure 1. Expression levels of miR-202-3p in EH patients and control subjects.
The expression of miR-202-3p was detected in 159 patients and 168 control subjects. Relative expression levels were normalized to U6b and then log 2-transformed. The whiskers of the plots represent the 2.5–97.5 percentiles. ***, P<0.001, miR-202-3p expression in EH patients vs. controls.

